The Process Dashboard includes an optional Charting and Reporting plug-in to help you visualize your data in new ways.
Here are some examples of the enhanced charts:
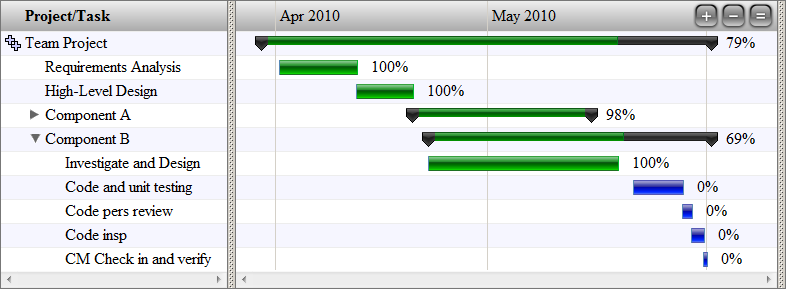
Gantt Chart
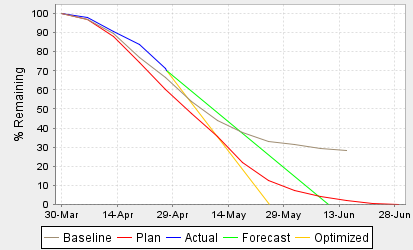
Burn-Down Chart
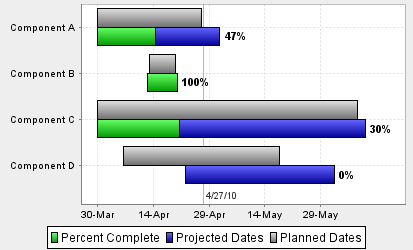
External Commitment Chart
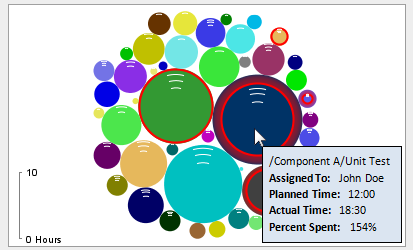
Tasks In Progress Chart
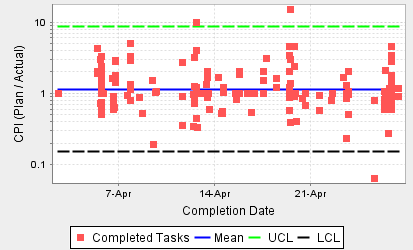
Control Chart of Completed Tasks CPI